1. Investments
The fund’s market value increased by 1,980 billion kroner to 17,745 billion kroner in the first half of 2024. The fund’s return for the period was 8.6 percent, or 1,478 billion kroner, which is 0.04 percentage point less than the return on the benchmark index.

Equities made up 72.0 percent of the value of the fund at the end of the period, fixed income 26.1 percent, unlisted real estate 1.7 percent and unlisted renewable energy infrastructure 0.1 percent.
The change in the fund’s market value comprised the return of 1,478 billion kroner, transfers from the government of 188 billion kroner, and 315 billion kroner from a weaker krone.
The fund is invested in international securities and unlisted real estate and infrastructure in foreign currency. Returns are measured primarily in international currency – a weighted combination of the currencies in the fund’s benchmark index for equities and bonds. Unless otherwise stated, the results in this report are measured in this currency basket.
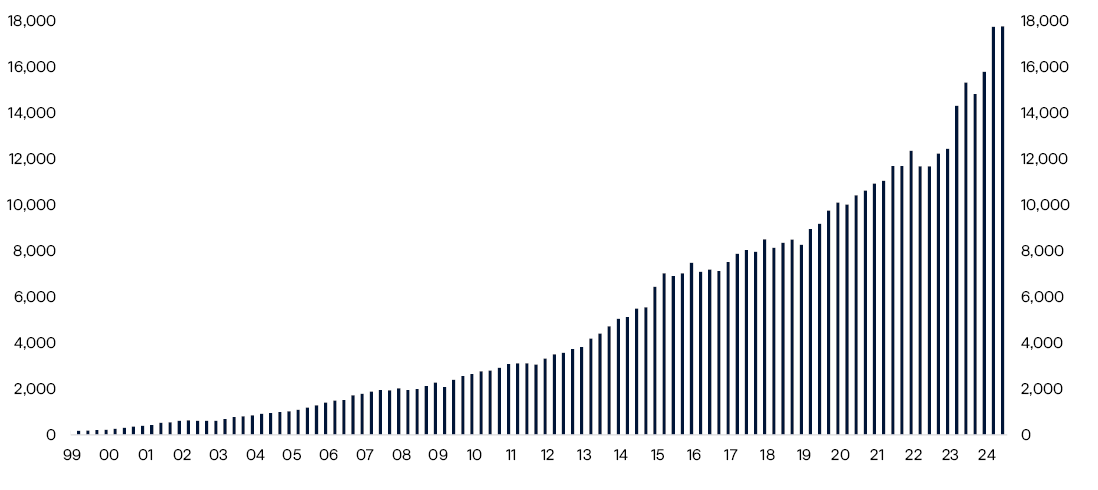
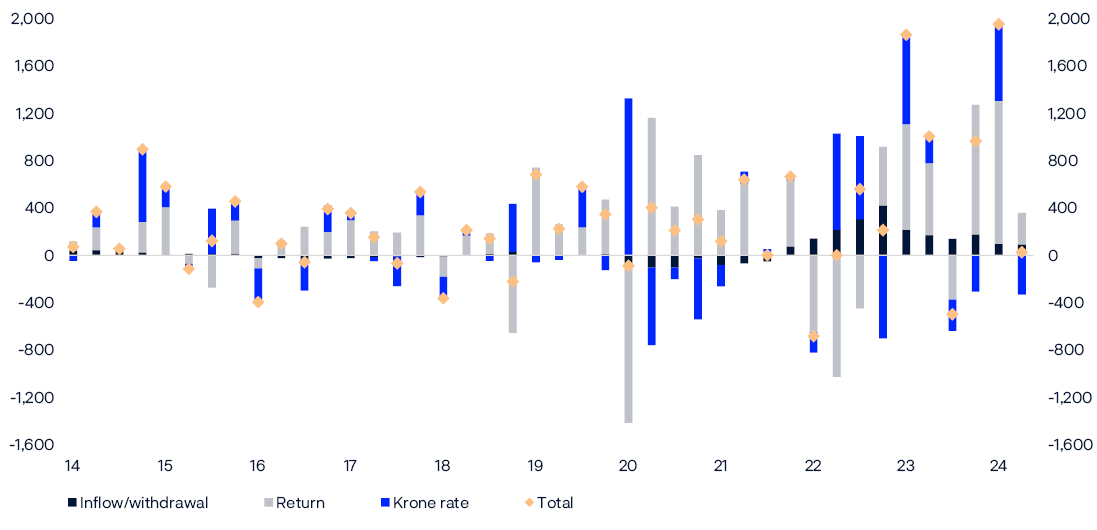
TABLE 1 Key figures in billions of kroner.
|
First half 2024 |
First quarter 2024 |
2023 |
|
|---|---|---|---|
|
Market value |
|||
|
Equity investments |
12,779 |
12,779 |
11,174 |
|
Fixed-income investments |
4,639 |
4,608 |
4,272 |
|
Unlisted real estate investments |
307 |
315 |
301 |
|
Unlisted infrastructure investments1 |
20 |
16 |
18 |
|
Market value of fund2 |
17,745 |
17,719 |
15,765 |
|
Deferred tax |
-12 |
-9 |
-8 |
|
Accrued, not paid, management fees3 |
0 |
-2 |
0 |
|
Owner's capital2 |
17,733 |
17,707 |
15,757 |
|
Inflow of capital |
192 |
96 |
711 |
|
Withdrawal of capital |
0 |
0 |
0 |
|
Paid management fees4 |
-4 |
0 |
-7 |
|
Return on fund5 |
1,478 |
1,210 |
2,222 |
|
Changes due to fluctuations in krone |
315 |
647 |
409 |
|
Total change in market value |
1,980 |
1,954 |
3,336 |
|
Changes in value since first capital inflow in 1996 |
|||
|
Total inflow of capital |
5,647 |
5,551 |
5,455 |
|
Total withdrawal of capital3 |
-687 |
-684 |
-687 |
|
Return on equity investments |
8,846 |
8,570 |
7,326 |
|
Return on fixed-income investments |
1,157 |
1,164 |
1,192 |
|
Return on unlisted real estate investments |
67 |
68 |
71 |
|
Return on unlisted infrastructure investments1 |
-1 |
0 |
2 |
|
Management fees4 |
-74 |
-72 |
-70 |
|
Changes due to fluctuations in krone |
2,789 |
3,122 |
2,474 |
|
Market value of fund |
17,745 |
17,719 |
15,765 |
|
Return on fund |
10,070 |
9,803 |
8,592 |
|
Return after management costs |
9,995 |
9,730 |
8,522 |
1 First unlisted infrastructure investment was made in the second quarter of 2021.
2 From 2023, market value is presented before management fee receivable and deferred tax. Up to and including 2022, market value was presented before management fee receivable.
3 Total inflow and withdrawal of capital shown in this table is adjusted for accrued, not paid, management fees.
4 Management fees are described in note 11 in the financial statements.
5 Fund return reflects the return on the market value of the investment portfolio, that does not include deferred tax. The portfolio result of 1,475 billion kroner in the financial statements includes the impact of changes in deferred tax.
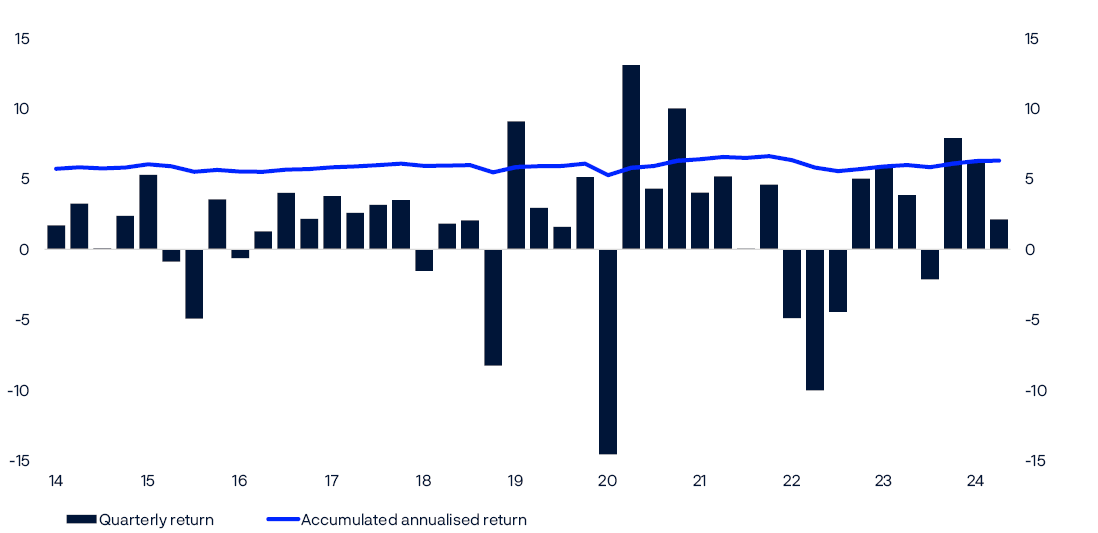
TABLE 2Return figures in percent. Measured in the fund's currency basket.
|
First half 2024 |
Second quarter 2024 |
First quarter 2024 |
|
|---|---|---|---|
|
Equity investments |
12.47 |
3.07 |
9.12 |
|
Fixed-income investments |
-0.62 |
-0.27 |
-0.35 |
|
Unlisted real estate investments |
-0.50 |
0.04 |
-0.54 |
|
Unlisted infrastructure investments |
-17.69 |
-7.11 |
-11.39 |
|
Return on fund |
8.59 |
2.12 |
6.33 |
|
Management costs |
0.02 |
0.01 |
0.01 |
|
Return on fund after management costs |
8.56 |
2.11 |
6.32 |
TABLE 3Historical key figures in percent as at 30 June 2024. Annualised data, measured in the fund's currency basket.
|
Since 01.01.1998 |
Last 10 years |
Last 12 months |
|
|---|---|---|---|
|
Fund return |
6.30 |
7.07 |
14.65 |
|
Annual price inflation |
2.14 |
2.49 |
2.77 |
|
Annual management costs |
0.08 |
0.05 |
0.04 |
|
Net real return on fund |
4.00 |
4.42 |
11.51 |
|
The fund's actual standard deviation |
8.43 |
9.69 |
9.98 |
Return on equity investments
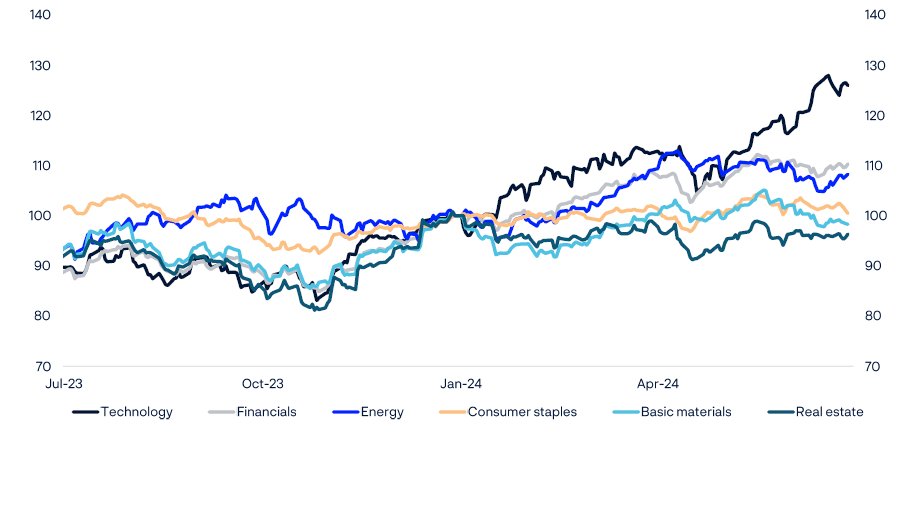
The fund’s equity investments had a strong first half, returning 12.5 percent for the period. The strongest returns were in the sectors technology, financials and health care. Basic materials had the weakest return.
Tech stocks perform best
Technology companies delivered a very strong return for the period of 27.9 percent. The sector benefited from strong demand for new AI solutions from the biggest internet and software companies and their semiconductor suppliers.
Financials returned 13.8 percent. Robust global economies and an increase in consumer borrowing resulted in higher bank revenue. Stronger stock markets and increased investment also contributed positively.
Health care stocks returned 10.3 percent, thanks to strong demand for health services, positive results from a number of major clinical studies, and increased demand for innovative treatments and technologies. More mergers and acquisitions and better financing for biotechnology also helped strengthen the sector.
Basic materials produced the weakest return for the period of -0.3 percent. A weak real estate market in China and subdued demand for materials in Europe pulled down performance in the sector.
A full list of the fund’s equity investments is published on www.nbim.no.
TABLE 4Return on the fund's equity investments in first half of 2024. In percent. Measured in the fund's currency basket.
|
Market |
Return |
Share of equity investments |
|---|---|---|
|
North America |
15.9 |
54.2 |
|
Europe |
8.3 |
25.0 |
|
Asia and Oceania |
10.4 |
20.1 |
|
Emerging markets |
12.6 |
10.5 |
TABLE 5Return on the fund's equity investments in first half of 2024. In percent. Measured in the fund's currency basket and sorted by sector.
|
Sector |
Return |
Share of equity investments1 |
|---|---|---|
|
Technology |
27.9 |
25.8 |
|
Financials |
13.8 |
15.0 |
|
Health care |
10.3 |
11.1 |
|
Energy |
10.3 |
3.6 |
|
Industrials |
8.2 |
12.7 |
|
Consumer discretionary |
7.9 |
13.7 |
|
Utilities |
6.2 |
2.3 |
|
Telecommunications |
5.2 |
3.0 |
|
Consumer staples |
1.4 |
5.1 |
|
Real estate |
1.2 |
5.0 |
|
Basic materials |
-0.3 |
3.6 |
1 Does not sum up to 100 percent because cash and derivatives are not included.
Return on fixed-income investments
Fixed-income investments returned -0.6 percent for the first half. Inflation slowed more quickly than expected towards the end of 2023, leading to expectations in the fixed-income market of a substantial easing of monetary policy in 2024. Inflation held at higher levels than expected in the first half of the year, however, and employment and economic growth surprised to the upside, especially in the US. This led to interest rates remaining higher than expected.
Policy rates higher for longer
Government bonds returned -1.8 percent for the period. The fund’s three largest holdings were of US, Japanese and German government bonds.
US Treasuries accounted for 29.1 percent of fixed-income investments and returned 1.1 percent. The Federal Reserve left its policy rate unchanged during the period. Two to three rate cuts are now expected by the market by the end of the year, down from the six expected at the beginning of the year.
Euro-denominated government bonds accounted for 12.3 percent of the fund’s fixed-income investments and returned -3.3 percent. The European Central Bank lowered its policy rate by 0.25 percentage point in June, and the market anticipates two further cuts by the end of the year.
Japanese government bonds made up 5.6 percent of fixed-income investments and returned -13.3 percent. The Bank of Japan tightened its monetary policy in March and no longer has a negative policy rate. This did not prevent the yen from depreciating further, and this was the main reason for the weak return.
A full list of the fund’s fixed-income investments is published on www.nbim.no.
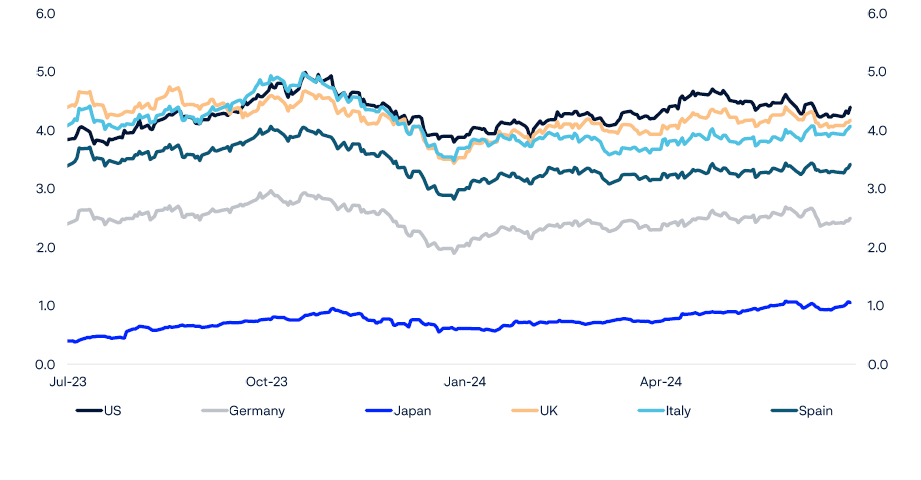
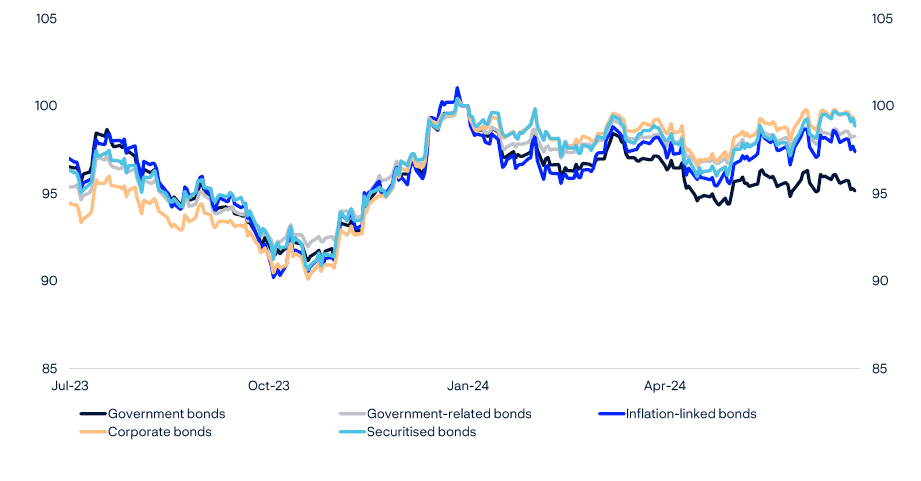
TABLE 6Return on the fund's fixed-income investments in the first half of 2024. In percent. Measured in the fund's currency basket and sorted by sector.
|
Sector |
Return |
Share of fixed-income investments1 |
|---|---|---|
|
Government bonds2 |
-1.8 |
58.5 |
|
Government-related bonds2 |
-0.6 |
9.5 |
|
Inflation-linked bonds2 |
-0.1 |
6.4 |
|
Corporate bonds |
1.8 |
24.8 |
|
Securitised bonds |
-0.3 |
6.7 |
1 Does not sum up to 100 percent because cash and derivatives are not included.
2 Governments may issue different types of bonds, and the fund's investments in these bonds are grouped accordingly. Bonds issued by a country's government in the country's own currency are categorised as government bonds. Bonds issued by a country's government in another country's currency are government-related bonds. Inflation-linked bonds issued by governments are grouped with inflation-linked bonds.
Return on real estate investments
The fund’s total real estate investments returned 1.5 percent for the first half and amounted to 3.6 percent of the fund at the end of the period. Unlisted and listed real estate investments are managed under a combined strategy for real estate.
Unlisted real estate investments made up 48.3 percent of the overall real estate portfolio and returned -0.5 percent, while investments in listed real estate returned 3.5 percent.
The fund’s unlisted real estate investments are primarily in office, retail and logistics properties. The negative return on unlisted real estate was driven mainly by investments in the US office sector. Values here were negatively affected by higher vacancy and a persistently high policy rate. There was also little activity in the market during the period, making property valuations a challenge. The fund’s investments in listed real estate span a variety of sectors. Solid returns in sectors such as data centres and retirement accommodation contributed positively to the results.
A full list of the fund’s real estate investments is published on www.nbim.no.
TABLE 7Value of real estate investments in millions of kroner as at 30 June 2024.
|
Verdi1 |
|
|---|---|
|
Unlisted real estate investments |
307,238 |
|
Listed real estate investments |
328,974 |
|
Total real estate investments |
636,212 |
1 Including bank deposits and other receivables.
TABLE 8Return on unlisted real estate investments in the first half of 2024.
In percentage points.
|
Return |
|
|---|---|
|
Rental income |
1.9 |
|
Changes in value |
-3.1 |
|
Transaction costs |
0.0 |
|
Result of currency adjustments |
0.7 |
|
Total |
-0.5 |
Return on unlisted renewable energy infrastructure investments
Investments in unlisted renewable energy infrastructure returned -17.7 percent for the first half of the year. The return on the portfolio comprises net income from power sales and changes in the value of the investments. A higher cost of capital adversely affected the value of the investments during the period. Besides projects already in operation, we have invested in a project under construction and committed capital for future projects. These projects are expected to generate net income in the future. This future net income will also be negatively affected by the current higher cost of capital.
The fund made three new investments during the period. In January, we signed an agreement to acquire a 49 percent interest in a portfolio of solar and onshore wind assets in Spain and Portugal for 307 million euros, or around 3.5 billion kroner. In April we signed an agreement to acquire a 49 percent stake in two solar projects in Spain for 203 million euros, or around 2.4 billion kroner. Also in April, we signed an agreement to acquire 37.5 percent of Race Bank, an operational offshore wind project in the UK, for 330 million pounds, or around 4.5 billion kroner, valuing the project as a whole at 2,599 million pounds, or around 35.3 billion kroner. The project includes a debt facility, of which our share is around 644 million pounds, or around 8.8 billion kroner.
A full list of the fund’s renewable energy infrastructure investments is published on www.nbim.no.
TABLE 9Value of unlisted renewable energy infrastructure investments in millions of kroner as at 30 June 2024.
|
Value1 |
|
|---|---|
|
Unlisted infrastructure investments |
19,723 |
1 Including bank deposits and other receivables.
TABLE 10Return of unlisted renewable energy infrastructure investments in the first half of 2024. In percent.
|
Return |
|
|---|---|
|
Unlisted infrastructure investments |
-17.7 |
The fund’s relative return
The return on the fund for the first half of the year was 0.04 percentage point less than the return on the benchmark index from the Ministry of Finance, corresponding to a relative return of -5 billion kroner.
Equity management made a positive contribution of 0.21 percentage point to the fund’s relative return for the period. Investments in the sectors consumer discretionary and financials made the most positive contributions, while basic materials made the most negative.
Fixed-income management contributed 0.04 percentage point to the relative return for the period. Investments in Europe made the greatest contribution. The fund has a higher share of short-maturity bonds than the benchmark index, which also contributed positively. The fund’s fixed-income investments include an allocation to emerging markets, which made a negative contribution to the relative return for the period.
Investments in real estate made the most negative contribution to the relative return for the first half, measured against the equities and bonds sold to finance these investments. Unlisted real estate investments contributed -0.08 percentage point. This negative result was driven primarily by investments in the US office sector. Listed real estate investments contributed -0.12 percentage point to the relative return, and investments in renewable energy infrastructure also made a slight negative contribution.
The relative return was also affected by an allocation effect between equity management and fixed-income management, as the fund was underweight in equities relative to bonds during the period. The contribution from this effect was -0.08 percentage point.
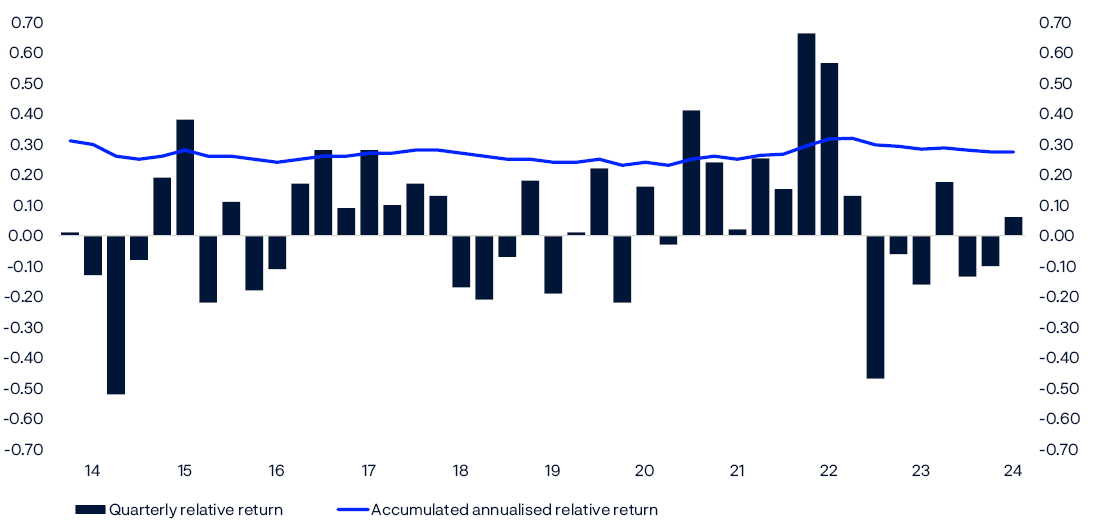
TABLE 11Historic relative return in percentage points as at 30 June 2024. Annualised figures measured in the fund's currency basket.
|
|
Since 01.01.1998 |
Last 15 years |
Last 10 years |
Last 5 years |
Last 12 months |
|---|---|---|---|---|---|
|
Relative return on fund (percentage points)1 |
0.27 |
0.42 |
0.23 |
0.42 |
0.02 |
|
The fund's tracking error (percentage points)1 |
0.64 |
0.44 |
0.41 |
0.45 |
0.28 |
|
The fund's information ratio (IR)1,2 |
0.44 |
0.89 |
0.53 |
0.83 |
0.01 |
1 Based on aggregated equity and fixed-income investments until end of 2016.
2 The fund's information ratio (IR) is the ratio of the fund's average monthly relative return to the fund's tracking error. The IR indicates how much relative return has been achieved per unit of relative risk.
TABLE 12Contributions from management areas to the fund's relative return in percentage points in the first half of 2024.
|
Total |
|
|---|---|
|
Equity management |
0.21 |
|
Fixed-income management |
0.04 |
|
Real assets management |
-0.21 |
|
Allocation effect |
-0.08 |
|
Total |
-0.04 |
The fund's investment framework
The fund is managed on the basis of limits set in the mandate from the Ministry of Finance.
TABLE 13Key figures for the fund's risk and exposure.
|
Limits set by the Ministry of Finance |
30.06.2024 |
|
|---|---|---|
|
Allocation |
Equity portfolio 60–80 percent of fund's market value1 |
72.1 |
|
Unlisted real estate no more than 7 percent of the fund's market value |
1.7 |
|
|
Fixed-income portfolio 20–40 percent of fund's market value1 |
27.3 |
|
|
Unlisted renewable energy infrastructure no more than 2 percent of the fund's market value |
0.1 |
|
|
Market risk |
1.25 percentage points expected relative volatility for the fund's investments |
0.4 |
|
Credit risk |
Maximum 5 percent of fixed-income investments may be rated below BBB- |
1.4 |
|
Emerging markets |
Maximum 5 percent of fixed-income investments may be in emerging markets |
2.9 |
|
Ownership |
Maximum 10 percent of voting shares in a listed company in the equity portfolio2 |
9.6 |
1 Derivatives are represented with their underlying economic exposure.
2 Investments in listed and unlisted real estate companies are exempt from this restriction.
Information on risk and exposure in each asset class is published on www.nbim.no.
Operational risk management
The Executive Board has decided there must be less than a 20 percent probability that operational risks result in gains and losses totalling 1 billion kroner or more over a 12-month period. This is referred to as the Executive Board’s operational risk tolerance.
Estimated operational risk exposure remained within the Executive Board’s tolerance limit in the first half of the year. A total of 82 unwanted operational events were registered, with an estimated financial impact of around 104 million kroner.
Responsible investment
The first half of the year is the busy season for voting, with more than two thirds of companies’ annual shareholder meetings taking place between April and June. Voting is one of the most important instruments available to us for exercising our ownership rights. We voted on a total of 90,449 proposals at 8,277 shareholder meetings in the first half of 2024. All of our voting is continuously updated at www.nbim.no. We also publish a summary of our voting in the first half of each year.
We had 1,775 meetings with companies during the period, raising governance and sustainability issues at 62.5 percent of them. These issues mostly concerned capital management, climate change and human capital.
2. Financial statements
|
Amounts in NOK million |
Note |
1H 2024 |
1H 2023 |
2023 |
|---|---|---|---|---|
|
Profit/loss on the portfolio before foreign exchange gain/loss |
||||
|
Income/expense from: |
||||
|
- Equities |
4 |
1 512 742 |
1 470 655 |
2 030 561 |
|
- Bonds |
4 |
-33 367 |
53 550 |
231 769 |
|
- Unlisted real estate |
6 |
-3 617 |
-20 834 |
-47 389 |
|
- Unlisted infrastructure |
7 |
-3 080 |
-1 769 |
-257 |
|
- Financial derivatives |
4 |
12 944 |
8 177 |
15 752 |
|
- Secured lending |
9 960 |
4 193 |
9 922 |
|
|
- Secured borrowing |
-10 609 |
-5 808 |
-13 278 |
|
|
Tax expense |
-10 077 |
-6 742 |
-13 555 |
|
|
Interest income/expense |
-325 |
-87 |
49 |
|
|
Other income/expense |
6 |
11 |
4 |
|
|
Profit/loss on the portfolio before foreign exchange gain/loss |
1 474 576 |
1 501 345 |
2 213 577 |
|
|
Foreign exchange gain/loss |
10 |
314 393 |
980 432 |
409 441 |
|
Profit/loss on the portfolio |
1 788 969 |
2 481 777 |
2 623 018 |
|
|
Management fee |
11 |
-4 267 |
-3 502 |
-6 632 |
|
Profit/loss and total comprehensive income |
1 784 703 |
2 478 274 |
2 616 385 |
|
Amounts in NOK million |
Note |
30.06.2024 |
31.12.2023 |
|---|---|---|---|
|
Assets |
|||
|
Deposits in banks |
17 454 |
8 584 |
|
|
Secured lending |
549 825 |
728 559 |
|
|
Cash collateral posted |
6 710 |
19 361 |
|
|
Unsettled trades |
149 625 |
33 812 |
|
|
Equities |
5 |
12 147 346 |
10 577 325 |
|
Equities lent |
5 |
627 188 |
493 949 |
|
Bonds |
5 |
4 264 896 |
3 563 613 |
|
Bonds lent |
5 |
652 416 |
1 006 711 |
|
Financial derivatives |
5 |
23 346 |
19 192 |
|
Unlisted real estate |
6 |
306 172 |
300 541 |
|
Unlisted infrastructure |
7 |
19 730 |
17 593 |
|
Withholding tax receivable |
16 617 |
10 522 |
|
|
Other assets |
2 221 |
2 752 |
|
|
Management fee receivable |
133 |
168 |
|
|
Total assets |
18 783 681 |
16 782 681 |
|
|
Liabilities and owner's capital |
|||
|
Secured borrowing |
787 494 |
911 548 |
|
|
Cash collateral received |
41 107 |
28 754 |
|
|
Unsettled trades |
187 228 |
44 247 |
|
|
Financial derivatives |
5 |
22 657 |
33 055 |
|
Deferred tax |
11 623 |
8 246 |
|
|
Other liabilities |
150 |
112 |
|
|
Total liabilities |
1 050 259 |
1 025 962 |
|
|
Owner's capital |
17 733 422 |
15 756 719 |
|
|
Total liabilities and owner's capital |
18 783 681 |
16 782 681 |
|
Amounts in NOK million, receipt (+) / payment (-) |
Note |
1H 2024 |
1H 2023 |
2023 |
|---|---|---|---|---|
|
Operating activities |
||||
|
Receipts of dividend from equities |
152 668 |
135 671 |
234 173 |
|
|
Receipts of interest from bonds |
59 825 |
41 148 |
90 644 |
|
|
Receipts of interest and dividend from unlisted real estate |
6 |
3 969 |
3 367 |
6 861 |
|
Receipts of interest and dividend from unlisted infrastructure |
7 |
232 |
457 |
752 |
|
Net receipts of interest and fee from secured lending and borrowing |
-1 805 |
-3 029 |
-3 730 |
|
|
Receipts of dividend, interest and fee from holdings of equities, bonds, unlisted real estate and unlisted infrastructure |
214 889 |
177 614 |
328 700 |
|
|
Net cash flow from purchase and sale of equities |
-163 398 |
-318 659 |
-436 867 |
|
|
Net cash flow from purchase and sale of bonds |
-264 478 |
37 690 |
-412 160 |
|
|
Net cash flow to/from investments in unlisted real estate |
6 |
-3 327 |
-4 382 |
-6 742 |
|
Net cash flow to/from investments in unlisted infrastructure |
7 |
-5 102 |
-1 923 |
-3 256 |
|
Net cash flow financial derivatives |
9 497 |
-13 468 |
2 219 |
|
|
Net cash flow cash collateral related to derivative transactions |
23 400 |
22 905 |
16 030 |
|
|
Net cash flow secured lending and borrowing |
21 844 |
-274 653 |
-184 578 |
|
|
Net payment of taxes |
-13 123 |
-7 261 |
-11 173 |
|
|
Net cash flow related to interest on deposits in banks and bank overdraft |
114 |
55 |
428 |
|
|
Net cash flow related to other income/expense, other assets and other liabilities |
9 |
1 298 |
947 |
|
|
Management fee paid to Norges Bank1 |
-4 232 |
-3 426 |
-6 526 |
|
|
Net cash inflow/outflow from operating activities |
-183 908 |
-384 210 |
-712 977 |
|
|
Financing activities |
||||
|
Inflow from the Norwegian government |
193 009 |
390 427 |
710 104 |
|
|
Withdrawal by the Norwegian government |
- |
- |
- |
|
|
Net cash inflow/outflow from financing activities |
193 009 |
390 427 |
710 104 |
|
|
Net change deposits in banks |
||||
|
Deposits in banks at 1 January |
8 584 |
12 061 |
12 061 |
|
|
Net increase/decrease of cash in the period |
9 101 |
6 216 |
-2 873 |
|
|
Net foreign exchange gain/loss on cash |
-232 |
-4 844 |
-604 |
|
|
Deposits in banks at end of period |
17 454 |
13 433 |
8 584 |
1 Management fee in the statement of cash flows consists of transfers to/from the krone account in connection with the settlement of management costs incurred in Norges Bank.
|
Amounts in NOK million |
Inflows from owner |
Retained earnings |
Total owner's capital |
|---|---|---|---|
|
1 January 2023 |
4 057 370 |
8 371 964 |
12 429 334 |
|
Profit/loss and total comprehensive income |
- |
2 478 274 |
2 478 274 |
|
Inflow during the period |
392 000 |
- |
392 000 |
|
Withdrawal during the period |
- |
- |
- |
|
30 June 2023 |
4 449 370 |
10 850 238 |
15 299 608 |
|
1 July 2023 |
4 449 370 |
10 850 238 |
15 299 608 |
|
Profit/loss and total comprehensive income |
- |
138 111 |
138 111 |
|
Inflow during the period |
319 000 |
- |
319 000 |
|
Withdrawal during the period |
- |
- |
- |
|
31 December 2023 |
4 768 370 |
10 988 349 |
15 756 719 |
|
1 January 2024 |
4 768 370 |
10 988 349 |
15 756 719 |
|
Profit/loss and total comprehensive income |
- |
1 784 703 |
1 784 703 |
|
Inflow during the period |
192 000 |
- |
192 000 |
|
Withdrawal during the period |
- |
- |
- |
|
30 June 2024 |
4 960 370 |
12 773 052 |
17 733 422 |
Notes
Note 1 General information
Introduction
Norges Bank is Norway’s central bank. Norges bank is a separate legal entity and is owned by the state. Norges bank manages the Government Pension Fund Global (GPFG) on behalf of the Ministry of Finance, in accordance with section 3, second paragraph of the Government Pension Fund Act and the management mandate for the GPFG, issued by the Ministry of Finance.
The GPFG shall support government saving to finance future expenditure and underpin long-term considerations relating to the use of Norway’s petroleum revenues. The Storting (Norwegian Parliament) has established the legal framework in the Government Pension Fund Act, and the Ministry of Finance has formal responsibility for the fund’s management. The Executive Board of Norges Bank has delegated day-to-day management of the GPFG to Norges Bank Investment Management (NBIM).
The Ministry of Finance has placed funds for investment in the GPFG in the form of a Norwegian krone deposit with Norges Bank (the krone account). Norges Bank manages the krone account in its own name by investing the funds in an investment portfolio consisting of listed equities, bonds, real estate and renewable energy infrastructure. The GPFG is invested in its entirety outside of Norway.
Transfers are made to and from the krone account in accordance with the management mandate. When the Norwegian State’s petroleum revenue exceeds the use of petroleum revenue in the fiscal budget, deposits will be made into the krone account. In the opposite situation, withdrawals will be made. Transfers to and from the krone account lead to a corresponding change in owner’s capital.
Approval of the interim financial statements
The interim financial statements of Norges Bank for the first half of 2024, which only encompass the financial reporting for the GPFG, were approved by the Executive Board on 9 August 2024.
Note 2 Accounting policies
Basis of preparation
In accordance with the Regulation on the financial reporting of Norges Bank (the Regulation), laid down by the Ministry of Finance, the financial reporting for the GPFG is prepared in accordance with IFRS Accounting Standards as adopted by the EU, based on the going concern assumption.
The condensed interim financial statements for the first half of 2024 are prepared in accordance with IAS 34 Interim Financial Reporting. The interim financial statements are presented in Norwegian kroner (NOK), rounded to the nearest million. Rounding differences may occur.
The interim financial statements are prepared using the same accounting policies and calculation methods as applied and disclosed in the annual report for 2023. The condensed interim financial statements do not include all the information and disclosures required in annual financial statements and should therefore be read in conjunction with the annual report for 2023.
Significant estimates and accounting judgements
The preparation of the interim financial statements involves the use of uncertain estimates and assumptions relating to future events that affect the reported amounts for assets, liabilities, income and expenses. Estimates are based on historical experience and reflect management’s expectations about future events. Actual outcomes may deviate from estimates. The preparation of the interim financial statements also involves the use of judgement when applying accounting policies, which may have a significant impact on the financial statements.
In cases where there are particularly uncertain estimates or accounting judgements, this is described in the respective notes.
Note 3 Returns
Table 3.1 Returns
|
1H 2024 |
1H 2023 |
2023 |
|
|---|---|---|---|
|
Returns measured in the fund's currency basket (percent) |
|||
|
Return on equity investments |
12.47 |
13.66 |
21.25 |
|
Return on fixed-income investments |
-0.62 |
2.25 |
6.13 |
|
Return on unlisted real estate investments |
-0.50 |
-4.57 |
-12.37 |
|
Return on unlisted infrastructure investments |
-17.69 |
-6.53 |
3.68 |
|
Return on fund |
8.59 |
10.00 |
16.14 |
|
Relative return on fund (percentage points) |
-0.04 |
-0.23 |
-0.18 |
|
Returns measured in Norwegian kroner (percent) |
|||
|
Return on equity investments |
15.32 |
23.80 |
26.26 |
|
Return on fixed-income investments |
1.90 |
11.36 |
10.51 |
|
Return on unlisted real estate investments |
2.02 |
3.94 |
-8.75 |
|
Return on unlisted infrastructure investments |
-15.61 |
1.81 |
7.96 |
|
Return on fund |
11.34 |
19.80 |
20.93 |
For additional information on the calculation methods used when measuring returns, see note 3 Returns in the annual report for 2023.
Note 4 Income/expense from equities, bonds and financial derivatives
Tables 4.1 to 4.3 specify the change in fair value in the period, wherethe line Income/expense shows the amount recognised in profit or loss for the respective income statement line.
Table 4.1 Specification Income/expense from equities
|
Amounts in NOK million |
1H 2024 |
1H 2023 |
2023 |
|---|---|---|---|
|
Dividends |
158 335 |
143 696 |
240 842 |
|
Realised gain/loss |
325 684 |
110 967 |
236 321 |
|
Unrealised gain/loss |
1 028 723 |
1 215 992 |
1 553 398 |
|
Income/expense from equities before foreign exchange gain/loss |
1 512 742 |
1 470 655 |
2 030 561 |
Table 4.2 Specification Income/expense from bonds
|
Amounts in NOK million |
1H 2024 |
1H 2023 |
2023 |
|---|---|---|---|
|
Interest |
71 375 |
51 263 |
109 431 |
|
Realised gain/loss |
-41 233 |
-63 804 |
-101 065 |
|
Unrealised gain/loss |
-63 509 |
66 090 |
223 402 |
|
Income/expense from bonds before foreign exchange gain/loss |
-33 367 |
53 550 |
231 769 |
Table 4.3 Specification Income/expense from financial derivatives
|
Amounts in NOK million |
1H 2024 |
1H 2023 |
2023 |
|---|---|---|---|
|
Interest |
-1 602 |
817 |
4 185 |
|
Realised gain/loss |
12 945 |
6 502 |
13 404 |
|
Unrealised gain/loss |
1 602 |
858 |
-1 837 |
|
Income/expense from financial derivatives before foreign exchange gain/loss |
12 944 |
8 177 |
15 752 |
Note 5 Holdings of equities, bonds and financial derivatives
Table 5.1 Equities
|
Amounts in NOK million |
30.06.2024 Fair value incl. earned dividends |
31.12.2023 Fair value incl. earned dividends |
|---|---|---|
|
Technology |
3 263 279 |
2 465 516 |
|
Financials |
1 900 146 |
1 655 254 |
|
Consumer discretionary |
1 728 746 |
1 562 073 |
|
Industrials |
1 605 254 |
1 447 684 |
|
Health care |
1 405 283 |
1 230 877 |
|
Consumer staples |
646 337 |
618 337 |
|
Real estate |
633 562 |
608 689 |
|
Basic materials |
452 093 |
441 742 |
|
Energy |
459 149 |
413 062 |
|
Telecommunications |
385 204 |
367 904 |
|
Utilities |
295 480 |
260 137 |
|
Total equities |
12 774 535 |
11 071 274 |
|
Of which presented in the balance sheet line Equities |
12 147 346 |
10 577 325 |
|
Of which presented in the balance sheet line Equities lent |
627 188 |
493 949 |
At the end of the first half of 2024, earned dividends amounted to NOK 15 793 million (NOK 12 580 million at the end of 2023).
Table 5.2 Bonds
|
30.06.2024 |
31.12.2023 |
|||
|---|---|---|---|---|
|
Amounts in NOK million |
Notional value |
Fair value incl. earned interest |
Notional value |
Fair value incl. earned interest |
|
Government bonds |
2 931 082 |
2 718 096 |
2 742 815 |
2 594 816 |
|
Government-related bonds |
464 963 |
441 912 |
433 944 |
406 977 |
|
Inflation-linked bonds |
313 543 |
295 665 |
232 929 |
283 137 |
|
Corporate bonds |
1 223 541 |
1 150 223 |
1 055 498 |
1 002 288 |
|
Securitised bonds |
335 988 |
311 415 |
307 782 |
283 106 |
|
Total bonds |
5 269 117 |
4 917 312 |
4 772 968 |
4 570 324 |
|
Of which presented in the balance sheet line Bonds |
4 264 896 |
3 563 613 |
||
|
Of which presented in the balance sheet line Bonds lent |
652 416 |
1 006 711 |
||
At the end of the first half of 2024, earned interest amounted to NOK 42 762 million (NOK 34 537 million at the end of 2023).
Financial derivatives
Financial derivatives are used to adjust the exposure in various portfolios as a cost-efficient alternative to trading in the underlying securities. Foreign exchange derivatives are also used in connection with liquidity management. Equity derivatives with an option component are often a result of corporate actions, and can be converted into equities or sold. The GPFG also uses equity swaps in combination with purchase and sale of equities. Equity swaps are not recognised in the balance sheet. See the accounting policy in note 13 Secured lending and borrowing in the annual report for 2023 for further information.
Table 5.3 specifies financial derivatives recognised in the balance sheet. Notional amounts are the basis for calculating any cash flows and gains/losses for derivative contracts. This provides information on the extent to which different types of financial derivatives are used.
Table 5.3 Financial derivatives
|
30.06.2024 |
31.12.2023 |
|||||
|---|---|---|---|---|---|---|
|
Amounts in NOK million |
Notional amount |
Fair value |
Notional amount |
Fair value |
||
|
Asset |
Liability |
Asset |
Liability |
|||
|
Foreign exchange derivatives |
914 542 |
9 355 |
7 442 |
976 868 |
6 388 |
18 148 |
|
Interest rate derivatives |
2 026 818 |
13 044 |
10 618 |
464 466 |
11 920 |
12 323 |
|
Credit derivatives |
128 614 |
753 |
4 522 |
52 311 |
706 |
2 556 |
|
Equity derivatives1 |
- |
29 |
- |
- |
69 |
- |
|
Exchange-traded futures contracts2 |
162 417 |
165 |
76 |
95 742 |
110 |
29 |
|
Total financial derivatives |
3 232 391 |
23 346 |
22 657 |
1 589 387 |
19 192 |
33 055 |
1 Notional amounts are not considered relevant for equity derivatives and are therefore not included in the table.
2 Exchange-traded futures contracts have daily margin payments and the net amount recognised in the balance sheet is normally zero at the balance sheet date, with the exception of futures contracts in certain markets where there is different timing for setting the market value for recognition in the balance sheet and daily margining.
Note 6 Unlisted real estate
Investments in unlisted real estate are made through subsidiaries of Norges Bank, exclusively established as part of the management of the GPFG. Subsidiaries presented as Unlisted real estate in the balance sheetare measured at fair value through profit or loss. The fair value of unlisted real estate is equivalent to the sum of the GPFG’s share of assets and liabilities in the underlying real estate subsidiaries, measured at fair value. For further information, see note 2 Accounting policiesandnote8 Fair value measurementin the annual report for 2023.
Income/expense, changes in carrying amounts and cash flows related to investments in unlisted real estate are specified in the tables below. See note 6 Unlisted real estate in the annual report for 2023 for further information on the principles applied in the tables.
Table 6.1 Income/expense from unlisted real estate
|
Amounts in NOK million |
1H 2024 |
1H 2023 |
2023 |
|---|---|---|---|
|
Receipts of interest and dividend |
3 969 |
3 367 |
6 861 |
|
Unrealised gain/loss1 |
-7 586 |
-24 201 |
-54 251 |
|
Income/expense from unlisted real estate before foreign exchange gain/loss |
-3 617 |
-20 834 |
-47 389 |
1 Earned interest and dividends which are not cash-settled are included in Unrealised gain/loss.
Table 6.2 Changes in carrying amounts unlisted real estate
|
Amounts in NOK million |
30.06.2024 |
31.12.2023 |
|---|---|---|
|
Unlisted real estate at 1 January |
300 541 |
329 732 |
|
Net cash flow to/from investments |
3 327 |
6 742 |
|
Unrealised gain/loss |
-7 586 |
-54 251 |
|
Foreign exchange gain/loss |
9 889 |
18 318 |
|
Unlisted real estate, closing balance for the period |
306 172 |
300 541 |
Table 6.3 specifies cash flows between the GPFG and subsidiaries presented as Unlisted real estate.
Table 6.3 Cash flow unlisted real estate
|
Amounts in NOK million |
1H 2024 |
1H 2023 |
2023 |
|---|---|---|---|
|
Receipts of interest from ongoing operations |
1 387 |
1 007 |
2 042 |
|
Receipts of dividends from ongoing operations |
2 548 |
2 360 |
4 709 |
|
Receipts of interest from sales |
33 |
- |
110 |
|
Receipts of interest and dividend from unlisted real estate |
3 969 |
3 367 |
6 861 |
|
Payments for new investments |
-2 208 |
-4 449 |
-7 007 |
|
Payments for property development |
-1 502 |
-876 |
-1 778 |
|
Net payments external debt |
- |
- |
-104 |
|
Receipts from ongoing operations |
357 |
761 |
1 533 |
|
Receipts from sales |
26 |
182 |
615 |
|
Net cash flow to/from investments in unlisted real estate |
-3 327 |
-4 382 |
-6 742 |
|
Net cash flow unlisted real estate |
642 |
-1 016 |
119 |
|
Of which cash flow from ongoing operations |
4 293 |
4 128 |
8 284 |
|
Of which cash flow to/from investment activities |
-3 651 |
-5 144 |
-8 164 |
Underlying real estate companies
Real estate subsidiaries have investments in other non-consolidated, unlisted companies. For further information, see note 16 Interests in other entitiesin the annual report for 2023.
Table 6.4 specifies the GPFG’s share of net income generated in the underlying real estate companies, which is the basis for Income/expense from unlisted real estatepresented in table 6.1.
Table 6.4 Income from underlying real estate companies
|
Amounts in NOK million |
1H 2024 |
1H 2023 |
2023 |
|---|---|---|---|
|
Net rental income |
7 122 |
6 945 |
13 852 |
|
External asset management - fixed fees |
-499 |
-540 |
-1 044 |
|
External asset management - variable fees |
-1 |
-2 |
-23 |
|
Internal asset management - fixed fees1 |
-56 |
-62 |
-123 |
|
Operating costs in wholly-owned subsidiaries2 |
-33 |
-41 |
-82 |
|
Operating costs in joint ventures |
-88 |
-58 |
-171 |
|
Interest expense external debt |
-353 |
-420 |
-776 |
|
Tax expense |
-148 |
-133 |
-210 |
|
Net income from ongoing operations |
5 945 |
5 688 |
11 424 |
|
Realised gain/loss |
92 |
1 |
46 |
|
Unrealised gain/loss3 |
-9 657 |
-26 302 |
-58 630 |
|
Realised and unrealised gain/loss |
-9 564 |
-26 301 |
-58 584 |
|
Transaction costs and fees from purchases and sales |
3 |
-222 |
-229 |
|
Net income underlying real estate companies |
-3 617 |
-20 834 |
-47 389 |
1 Internal asset management is carried out by employees in a wholly-owned, consolidated subsidiary.
2 Operating costs in wholly-owned subsidiaries are measured against the upper limit from the Ministry of Finance, see note 11 Management costs for more information.
3 Unrealised gain/loss presented in table 6.1 includes net income in the underlying real estate companies which is not distributed back to the GPFG, and will therefore not correspond to Unrealised gains/loss presented in table 6.4.
Table 6.5 specifies the GPFG’s share of assets and liabilities in the underlying real estate companies, which comprises the closing balance for Unlisted real estate presented in table 6.2.
Table 6.5 Assets and liabilities underlying real estate companies
|
Amounts in NOK million |
30.06.2024 |
31.12.2023 |
|---|---|---|
|
Properties |
332 842 |
327 165 |
|
External debt |
-25 558 |
-25 564 |
|
Net other assets and liabilities1 |
-1 111 |
-1 060 |
|
Total assets and liabilities underlying real estate companies |
306 172 |
300 541 |
1 Net other assets and liabilities comprise cash, tax and operational receivables and liabilities.
Note 7 Unlisted renewable energy infrastructure
Investments in unlisted renewable energy infrastructure (Unlisted infrastructure) are made through subsidiaries of Norges Bank, exclusively established as part of the management of the GPFG. Subsidiaries presented as Unlisted infrastructurein the balance sheetare measured at fair value through profit or loss. The fair value of unlisted infrastructure is equivalent to the sum of the GPFG’s share of assets and liabilities in the underlying infrastructure subsidiaries, measured at fair value. For further information, see note 2 Accounting policies and note 8 Fair value measurementin the annual report for 2023.
Income/expense, changes in carrying amounts and cash flows related to investments in unlisted infrastructure are specified in the tables below. See note 7 Unlisted renewable energy infrastructure in the annual report for 2023 for further information on the principles applied in the tables.
Table 7.1 Income/expense from unlisted infrastructure
|
Amounts in NOK million |
1H 2024 |
1H 2023 |
2023 |
|---|---|---|---|
|
Payments of interest and dividend |
232 |
457 |
752 |
|
Unrealised gain/loss1 |
-3 312 |
-2 226 |
-1 010 |
|
Income/expense from unlisted infrastructure before foreign exchange gain/loss |
-3 080 |
-1 769 |
-257 |
1 Earned interest and dividends which are not cash-settled are included in Unrealised gain/loss.
Table 7.2 Changes in carrying amounts unlisted infrastructure
|
Amounts in NOK million |
30.06.2024 |
31.12.2023 |
|---|---|---|
|
Unlisted infrastructure at 1 January |
17 593 |
14 489 |
|
Net cash flow to/from investments |
5 102 |
3 256 |
|
Unrealised gain/loss |
-3 312 |
-1 010 |
|
Foreign exchange gain/loss |
346 |
859 |
|
Unlisted infrastructure, closing balance for the period |
19 730 |
17 593 |
Table 7.3 specifies cash flows between the GPFG and subsidiaries presented as Unlisted infrastructure.
Table 7.3 Cash flow unlisted infrastructure
|
Amounts in NOK million |
1H 2024 |
1H 2023 |
2023 |
|---|---|---|---|
|
Receipts of interest from ongoing operations |
199 |
143 |
397 |
|
Receipts of dividends from ongoing operations |
33 |
314 |
355 |
|
Receipts of interest and dividend from unlisted infrastructure |
232 |
457 |
752 |
|
Payments for new investments |
-4 941 |
-2 643 |
-2 939 |
|
Payments for development of infrastructure assets |
-436 |
- |
-1 071 |
|
Receipts from ongoing operations |
275 |
720 |
755 |
|
Net cash flow to/from investments in unlisted infrastructure |
-5 102 |
-1 923 |
-3 256 |
|
Net cash flow unlisted infrastructure |
-4 870 |
-1 466 |
-2 504 |
|
Of which cash flow from ongoing operations |
507 |
1 177 |
1 507 |
|
Of which cash flow to/from investment activities |
-5 378 |
-2 643 |
-4 010 |
Underlying infrastructure companies
Infrastructure subsidiaries have investments in other non-consolidated, unlisted companies. For further information, see note 16 Interests in other entitiesin the annual report for 2023.
Table 7.4 specifies the GPFG’s share of net income generated in the underlying infrastructure companies, which is the basis for Income/expense from unlisted infrastructure presented in table 7.1.
Table 7.4 Income from underlying infrastructure companies
|
Amounts in NOK million |
1H 2024 |
1H 2023 |
2023 |
|---|---|---|---|
|
Net income from sale of renewable energy |
445 |
757 |
1 356 |
|
Operating costs in wholly owned subsidiaries1 |
-5 |
-3 |
-8 |
|
Operating costs in joint ventures |
2 |
-8 |
-32 |
|
Tax expense |
-9 |
-65 |
-70 |
|
Interest income/expense |
-5 |
12 |
26 |
|
Net income from ongoing operations |
429 |
692 |
1 273 |
|
Unrealised gain/loss2 |
-3 449 |
-2 421 |
-1 468 |
|
Transaction costs and fees from purchases |
-60 |
-40 |
-62 |
|
Net income underlying infrastructure companies |
-3 080 |
-1 769 |
-257 |
1 Operating costs in wholly owned subsidiaries are measured against the upper limit from the Ministry of Finance, see note 11 Management costs for more information.
2 Unrealised gain/loss presented in table 7.1 includes net income in the underlying infrastructure companies which is not distributed back to the GPFG, and will therefore not correspond to Unrealised gains/loss presented in table 7.4.
Table 7.5 specifies the GPFG’s share of assets and liabilities in the underlying infrastructure companies, which comprises the closing balance for Unlisted infrastructure as presented in table 7.2.
Table 7.5 Assets and liabilities underlying infrastructure companies
|
Amounts in NOK million |
30.06.2024 |
31.12.2023 |
|---|---|---|
|
Infrastructure assets |
27 696 |
15 936 |
|
External debt |
-8 688 |
- |
|
Net other assets and liabilities1 |
722 |
1 657 |
|
Total assets and liabilities underlying infrastructure companies |
19 730 |
17 593 |
1 Net other assets and liabilities comprise cash, tax and operational receivables and liabilities.
Note 8 Fair value measurement
Fair value for the majority of assets and liabilities is based on quoted market prices or observable market inputs. If the market is not active, fair value is established using standard valuation techniques. Estimating fair value can be complex and require the use of judgement, in particular when observable inputs are not available. For an overview of valuation models and techniques, as well as definitions and the classification in the three categories in the fair value hierarchy, see note 8 Fair value measurement in the annual report for 2023.
Significant estimates
Classification in the fair value hierarchy is based on set criteria, some of which may require the use of judgement.
Level 3 investments consist of instruments measured at fair value that are not traded or quoted in active markets. Fair value is determined using valuation techniques that use models with significant use of unobservable inputs. A considerable degree of judgement is applied in determining the assumptions that market participants would use when pricing the asset or liability, when observable market data is not available.
The fair value hierarchy
Table 8.1 Categorisation of the investment portfolio by level in the fair value hierarchy
|
Level 1 |
Level 2 |
Level 3 |
Total |
|||||
|---|---|---|---|---|---|---|---|---|
|
Amounts in NOK million |
30.06.2024 |
31.12.2023 |
30.06.2024 |
31.12.2023 |
30.06.2024 |
31.12.2023 |
30.06.2024 |
31.12.2023 |
|
Equities |
12 740 003 |
11 033 488 |
32 807 |
36 286 |
1 725 |
1 500 |
12 774 535 |
11 071 274 |
|
Government bonds |
2 562 049 |
2 165 249 |
156 047 |
429 567 |
- |
- |
2 718 096 |
2 594 816 |
|
Government-related bonds |
383 365 |
340 242 |
57 594 |
65 926 |
953 |
809 |
441 912 |
406 977 |
|
Inflation-linked bonds |
269 774 |
220 652 |
25 891 |
62 485 |
- |
- |
295 665 |
283 137 |
|
Corporate bonds |
1 135 004 |
942 658 |
15 218 |
59 628 |
1 |
2 |
1 150 223 |
1 002 288 |
|
Securitised bonds |
282 799 |
256 012 |
28 617 |
26 989 |
- |
105 |
311 415 |
283 106 |
|
Total bonds |
4 632 991 |
3 924 813 |
283 367 |
644 595 |
954 |
916 |
4 917 312 |
4 570 324 |
|
Financial derivatives (assets) |
605 |
282 |
22 729 |
18 906 |
12 |
4 |
23 346 |
19 192 |
|
Financial derivatives (liabilities) |
-3 184 |
-1 633 |
-19 473 |
-31 422 |
- |
- |
-22 657 |
-33 055 |
|
Total financial derivatives |
-2 579 |
-1 351 |
3 256 |
-12 516 |
12 |
4 |
689 |
-13 863 |
|
Unlisted real estate |
- |
- |
- |
- |
306 172 |
300 541 |
306 172 |
300 541 |
|
Unlisted infrastructure |
- |
- |
- |
- |
19 730 |
17 593 |
19 730 |
17 593 |
|
Other (assets)1 |
- |
- |
742 453 |
803 590 |
- |
- |
742 453 |
803 590 |
|
Other (liabilities)2 |
- |
- |
-1 015 979 |
-984 661 |
- |
- |
-1 015 979 |
-984 661 |
|
Market value investment portfolio3 |
17 370 415 |
14 956 950 |
45 904 |
487 294 |
328 593 |
320 554 |
17 744 911 |
15 764 797 |
|
Total (percent) |
97.9 |
94.9 |
0.3 |
3.1 |
1.8 |
2.0 |
100.0 |
100.0 |
1 Other (assets) consists of the balance sheet lines Deposits in banks, Secured lending, Cash collateral posted, Unsettled trades (assets), Withholding tax receivable and Other assets.
2 Other (liabilities) consists of the balance sheet lines Secured borrowing, Cash collateral received, Unsettled trades (liabilities) and Other liabilities.
3 Market value investment portfolio is exclusive of Management fee payable/receivable and Deferred tax.
The majority of the total portfolio is priced based on observable market prices. At the end of the first half of 2024, 98.2 percent of the portfolio was classified as Level 1 or 2, which is a marginal increase compared to year-end 2023.
Equities
Measured as a share of total value, virtually all equities (99.73 percent) were valued based on official closing prices from stock exchanges and were classified as Level 1 at the end of the first half. A small share of equities (0.26 percent) were classified as Level 2. These are mainly equities for which trading has recently been suspended, or illiquid securities that are not traded daily. The share of equities valued with significant use of unobservable inputs and classified as Level 3 was 0.01 percent. These are equities that are not listed, or where trading has been suspended and an adjustment has been applied to the last traded price based on company- or country-specific factors.
Bonds
The majority of bonds have observable, executable market quotes in active markets and 94.22 percent were classified as Level 1 at the end of the first half. Bond holdings that do not have a sufficient number of observable quotes or that are priced based on comparable liquid bonds are classified as Level 2. These amounted to 5.76 percent of bond holdings at the end of the first half. An insignificant share of bond holdings (0.02 percent) that did not have observable quotes were classified as Level 3, since the valuation was based on significant use of unobservable inputs.
Unlisted real estate and unlisted renewable energy infrastructure
All investments in unlisted real estate and unlisted renewable energy infrastructure are classified as Level 3, since models are used to value the underlying assets and liabilities, with extensive use of unobservable market inputs. Properties and investments in unlisted infrastructure are measured at the value determined by external valuers. Exceptions to this policy are newly acquired investments where the purchase price, excluding transaction costs, is normally considered to be the best estimate of fair value, or where there are indications that the external valuation does not reflect fair value and adjustments are therefore warranted.
Financial derivatives
Some equity derivatives (rights and warrants) and credit derivatives (CDS indices) that are actively traded, are classified as Level 1. The majority of derivatives are classified as Level 2, since the valuation of these is based on standard models using observable market inputs. Certain derivatives are valued based on models with significant use of unobservable inputs and are classified as Level 3.
Other assets and liabilities that are part of the investment portfolio are classified as Level 2.
Movements between the levels in the fair value hierarchy
There were no significant reclassifications of equity holdings between the levels in the fair value hierarchy during the first half.
Bond holdings with a net value of NOK 109 billion were reclassified from Level 2 to Level 1 in the first half. Bonds with a value of NOK 123 billion were reclassified from Level 2 to Level 1, primarily due to improved liquidity for certain holdings of corporate bonds and government bonds. This was partly offset by bonds with a value of NOK 14 billion which were reclassified from Level 1 to Level 2. There were no significant reclassifications of bonds holdings into or out of Level 3 in the first half.
Table 8.2 Changes in Level 3 holdings
|
Amounts in NOK million |
01.01.2024 |
Purchases |
Sales |
Settlements |
Net gain/loss |
Transferred into Level 3 |
Transferred out of Level 3 |
Foreign exchange gain/loss |
30.06.2024 |
|---|---|---|---|---|---|---|---|---|---|
|
Equities |
1 500 |
22 |
-28 |
- |
123 |
1 |
- |
107 |
1 725 |
|
Bonds |
916 |
- |
- |
-19 |
-42 |
404 |
-352 |
47 |
954 |
|
Financial derivatives (assets) |
4 |
8 |
- |
- |
- |
- |
- |
- |
12 |
|
Unlisted real estate1 |
300 541 |
3 327 |
- |
- |
-7 586 |
- |
- |
9 889 |
306 172 |
|
Unlisted infrastructure1 |
17 593 |
5 102 |
- |
- |
-3 312 |
- |
- |
346 |
19 730 |
|
Total |
320 554 |
8 459 |
-28 |
-19 |
-10 817 |
405 |
-352 |
10 389 |
328 593 |
|
Amounts in NOK million |
01.01.2023 |
Purchases |
Sales |
Settlements |
Net gain/loss |
Transferred into Level 3 |
Transferred out of Level 3 |
Foreign exchange gain/loss |
31.12.2023 |
|---|---|---|---|---|---|---|---|---|---|
|
Equities |
3 206 |
- |
-100 |
-21 |
-1 328 |
47 |
-1 |
-303 |
1 500 |
|
Bonds |
340 |
245 |
-147 |
-54 |
45 |
563 |
-97 |
20 |
916 |
|
Financial derivatives (assets) |
45 |
4 |
-45 |
- |
- |
- |
- |
- |
4 |
|
Unlisted real estate1 |
329 732 |
6 742 |
- |
- |
-54 251 |
- |
- |
18 318 |
300 541 |
|
Unlisted infrastructure1 |
14 489 |
3 256 |
- |
- |
-1 010 |
- |
- |
859 |
17 593 |
|
Total |
347 812 |
10 247 |
-292 |
-75 |
-56 544 |
610 |
-98 |
18 894 |
320 554 |
1 Purchases represent the net cash flow to investments in unlisted real estate and unlisted infrastructure, as presented in the Statement of cash flows.
The share of the portfolio classified as Level 3 was 1.8 percent at the end of the first half, which is a slight decrease compared to year-end 2023. The GPFG’s aggregate holdings in Level 3 were NOK 328 593 million at the end of the first half, an increase of NOK 8 039 million compared to year-end 2023. The increase is mainly due to investment in unlisted real estate and unlisted renewable energy infrastructure which are all classified as Level 3.
Russian equities constitute the majority of equity securities classified as Level 3 at the end of the first half. Trading in Russian securities is regulated by extensive sanctions. In line with the methodology applied at year-end, a downward adjustment has been applied to the last traded price of these securities in order to estimate the price that would be received for the sale of the shares under current market conditions. The downward adjustment reflects the estimated discount that market participants would demand to reflect the risk associated with the inherent uncertainty in the cash flows of the shareholdings, as well as the inability to access a public market to trade the shares. The adjustment to the last traded price is based on unobservable inputs and is considered to be significant to the fair value measurement. At the end of the first half, these equity securities had a value of NOK 1.5 billion, compared to NOK 1.4 billion at year-end 2023.
Sensitivity analysis for Level 3 holdings
The valuation of Level 3 holdings involves the use of judgement when determining the assumptions that market participants would use when observable market data is not available.
Unlisted real estate investments constitute the vast majority of holdings classified as Level 3. The effect of using reasonable alternative assumptions for unlisted real estate investments is shown in the sensitivity analysis in table 8.3. For other holdings classified as Level 3, there are no significant changes to sensitivities compared to year-end 2023.
Table 8.3 Additional specification Level 3 and sensitivities - unlisted real estate
|
Amounts in NOK million |
Key assumptions |
Change in key assumptions |
Specification of Level 3 holdings 30.06.2024 |
Sensitivities 30.06.2024 |
Specification of Level 3 holdings 31.12.2023 |
Sensitivities 31.12.2023 |
||
|---|---|---|---|---|---|---|---|---|
|
Unfavourable changes |
Favourable changes |
Unfavourable changes |
Favourable changes |
|||||
|
Unlisted real estate |
Yield |
0.25 percentage point |
-15 096 |
17 195 |
-14 818 |
16 879 |
||
|
Market rent |
2.0 percent |
-5 501 |
5 520 |
-5 400 |
5 419 |
|||
|
306 172 |
-20 597 |
22 715 |
300 541 |
-20 218 |
22 298 |
|||
Changes in key assumptions can have a material effect on the valuation of unlisted real estate investments. A number of key assumptions are used, of which yields and growth forecasts for future market rents are the assumptions that have the largest impact when estimating property values. This is illustrated in the sensitivity analysis by using other reasonable assumptions for yields and market rents. At the end of the first half, a change in the yield of 0.25 percentage point, and a change in market rents of 2 percent is viewed as a reasonable range for alternative assumptions. The sensitivity analysis is based on a statistically relevant sample that is representative for the unlisted real estate portfolio and reflects both favourable and unfavourable changes.
In an unfavourable outcome, an increase in the yield of 0.25 percentage point, and a reduction in market rents of 2 percent would result in a decrease in value of the unlisted real estate portfolio of approximately NOK 20 597 million or 6.7 percent (6.7 percent at year-end 2023). In a favourable outcome, a reduction in the yield of 0.25 percentage point and an increase in market rents of 2 percent would result in an increase in value of the unlisted real estate portfolio of approximately NOK 22 715 million or 7.4 percent (7.4 percent at year-end 2023). The isolated effects of changes in yields and future market rents are presented in table 8.3.
Changes outside of the ranges specified above are considered to be less reasonable alternative assumptions, however if the range of alternative assumptions were to be expanded, the value changes would be linear.
Note 9 Investment risk
Investment risk comprises market risk, credit risk and counterparty risk. For further information on the framework for investment risk, including the main dimensions and measurement methods used to manage investment risk, see note 9 Investment risk in the annual report for 2023.
Market risk
Market risk is the risk of loss or a change in the market value of the portfolio, or parts of the portfolio, due to changes in financial market variables, as well as real estate and infrastructure values. Norges Bank Investment Management measures market risk both in absolute terms and relative to the benchmark.
Asset class by country and currency
The portfolio is invested across several asset classes, countries and currencies as shown in table 9.1.
Table 9.1 Allocation by asset class, country and currency
|
Market value in percent by country and currency1 |
Market value by asset class in percent |
Market value by asset class in NOK million |
|||||||
|---|---|---|---|---|---|---|---|---|---|
|
Asset class |
Market |
30.06.2024 |
Market |
31.12.2023 |
30.06.2024 |
31.12.2023 |
30.06.2024 |
31.12.2023 |
|
|
Equities |
Developed |
89.4 |
Developed |
89.8 |
|||||
|
US |
51.6 |
US |
48.8 |
||||||
|
Japan |
6.7 |
Japan |
7.2 |
||||||
|
UK |
5.6 |
UK |
6.1 |
||||||
|
Switzerland |
3.6 |
France |
4.3 |
||||||
|
France |
3.5 |
Switzerland |
4.1 |
||||||
|
Total other |
18.3 |
Total other |
19.4 |
||||||
|
Emerging |
10.6 |
Emerging |
10.2 |
||||||
|
China |
3.1 |
China |
3.1 |
||||||
|
Taiwan |
2.5 |
India |
2.2 |
||||||
|
India |
2.5 |
Taiwan |
2.1 |
||||||
|
Brazil |
0.5 |
Brazil |
0.6 |
||||||
|
South Africa |
0.3 |
Mexico |
0.4 |
||||||
|
Total other |
1.7 |
Total other |
1.9 |
||||||
|
Total equities |
72.01 |
70.88 |
12 778 524 |
11 174 263 |
|||||
|
Fixed income |
Developed |
99.7 |
Developed |
99.8 |
|||||
|
US dollar |
52.6 |
US dollar |
51.2 |
||||||
|
Euro |
27.8 |
Euro |
28.2 |
||||||
|
Japanese yen |
6.4 |
Japanese yen |
6.9 |
||||||
|
British pound |
5.0 |
British pound |
5.0 |
||||||
|
Canadian dollar |
3.8 |
Canadian dollar |
3.9 |
||||||
|
Total other |
4.2 |
Total other |
4.6 |
||||||
|
Emerging2 |
0.3 |
Emerging2 |
0.2 |
||||||
|
Total fixed income |
26.15 |
27.10 |
4 639 427 |
4 271 746 |
|||||
|
Unlisted real estate |
US |
48.3 |
US |
48.6 |
|||||
|
UK |
19.1 |
UK |
18.7 |
||||||
|
France |
15.8 |
France |
15.7 |
||||||
|
Germany |
5.1 |
Germany |
5.3 |
||||||
|
Switzerland |
3.4 |
Switzerland |
3.6 |
||||||
|
Total other |
8.2 |
Total other |
8.0 |
||||||
|
Total unlisted real estate |
1.73 |
1.91 |
307 238 |
301 128 |
|||||
|
Total unlisted infrastructure |
0.11 |
0.11 |
19 723 |
17 660 |
|||||
|
Market value investment portfolio3 |
17 744 911 |
15 764 797 |
|||||||
1 Market value in percent per country and currency includes derivatives and cash.
2 The share of individual emerging market currencies in fixed income is insignificant.
3 Market value investment portfolio is exclusive of Management fee payable/receivable and Deferred tax.
At the end of the first half, the equity portfolio’s share of the fund was 72.0 percent, compared to 70.9 percent at year-end 2023. The bond portfolio’s share of the fund was 26.1 percent, compared to 27.1 percent at year-end. The unlisted real estate portfolio’s share of the fund was 1.7 percent, compared to 1.9 percent at year-end. The share of unlisted infrastructure in the fund was 0.1 percent, the same as at year-end.
Volatility
Risk models are used to quantify the risk of value changes associated with all or parts of the portfolio. One of the risk measures is expected volatility. Volatility is a standard risk measure based on the statistical concept of standard deviation. Expected volatility is defined as one standard deviation. Tables 9.2 and 9.3 present risk both in terms of the portfolio’s absolute risk and relative risk. All the fund’s investments are included in the calculations of expected relative volatility and are measured against the fund’s benchmark index consisting of global equity and bond indices. The fund’s management mandate specifies that expected relative volatility shall not exceed 1.25 percentage points.
Table 9.2 Portfolio risk, expected volatility, percent
|
Expected volatility, actual portfolio |
||||||||
|---|---|---|---|---|---|---|---|---|
|
30.06.2024 |
Min 2024 |
Max 2024 |
Average 2024 |
31.12.2023 |
Min 2023 |
Max 2023 |
Average 2023 |
|
|
Portfolio |
10.6 |
10.2 |
10.7 |
10.5 |
10.3 |
8.7 |
10.8 |
9.7 |
|
Equities |
12.9 |
12.4 |
13.0 |
12.7 |
12.5 |
11.3 |
15.0 |
12.4 |
|
Fixed income |
10.9 |
10.7 |
10.9 |
10.8 |
10.8 |
9.8 |
11.2 |
10.4 |
|
Unlisted real estate |
12.8 |
12.7 |
13.3 |
12.9 |
12.9 |
11.8 |
12.9 |
12.4 |
|
Unlisted infrastructure |
35.5 |
34.4 |
54.0 |
45.6 |
34.0 |
14.9 |
40.0 |
32.1 |
Table 9.3 Relative risk measured against the fund's benchmark index, expected relative volatility, basis points
|
Expected relative volatility |
||||||||
|---|---|---|---|---|---|---|---|---|
|
30.06.2024 |
Min 2024 |
Max 2024 |
Average 2024 |
31.12.2023 |
Min 2023 |
Max 2023 |
Average 2023 |
|
|
Portfolio |
36 |
34 |
37 |
35 |
34 |
33 |
41 |
36 |
Risk measured as expected volatility indicates an expected annual fluctuation in the value of the fund of 10.6 percent, or approximately NOK 1 890 billion at the end of the first half, compared to 10.3 percent at year-end 2023. Expected volatility for the equity portfolio was 12.9 percent at the end of the first half, up from 12.5 percent at year-end, while expected volatility for the bond portfolio was 10.9 percent, compared to 10.8 percent at year-end.
The fund’s expected relative volatility was 36 basis points at the end of the first half, compared to 34 basis points at year-end 2023.
Expected shortfall is a tail risk measure that quantifies the expected loss of a portfolio in extreme market situations. Expected shortfall measured on relative returns provides an estimate of the annual expected relative underperformance versus the benchmark index for a given confidence level. Using historical simulations, relative returns of the current portfolio compared to the benchmark index are calculated on a weekly basis over a sampling period from January 2007 until the end of the last accounting period. The expected shortfall at a 97.5 percent confidence level is then given by the annualised average relative return, measured in the currency basket for the 2.5 percent worst weeks.
The Executive Board has determined that the fund shall be managed in such a way that the annual expected shortfall measured against the benchmark index does not exceed 3.75 percentage points. At the end of the first half, expected shortfall was 1.13 percentage points, compared to 1.08 percentage points at year-end 2023.
Credit risk
Credit risk is the risk of losses resulting from issuers of bonds defaulting on their payment obligations. Credit risk for the bond portfolio is monitored, among other things, through the use of credit ratings. Fixed-income instruments in the portfolio’s benchmark index are all rated investment grade by one of the major credit rating agencies.
Table 9.4 Bond portfolio specified by credit rating
|
Amounts in NOK million, 30.06.2024 |
AAA |
AA |
A |
BBB |
Lower rating |
Total |
|---|---|---|---|---|---|---|
|
Government bonds |
586 396 |
1 638 593 |
332 971 |
109 140 |
47 586 |
2 714 685 |
|
Government-related bonds |
211 969 |
168 723 |
34 756 |
23 046 |
3 419 |
441 912 |
|
Inflation-linked bonds |
48 177 |
215 057 |
14 665 |
17 767 |
- |
295 665 |
|
Corporate bonds |
9 709 |
83 859 |
542 417 |
499 599 |
14 639 |
1 150 223 |
|
Securitised bonds |
271 220 |
38 386 |
1 695 |
114 |
- |
311 415 |
|
Total bonds1 |
1 127 471 |
2 144 618 |
926 504 |
649 665 |
65 644 |
4 913 900 |
|
Amounts in NOK million, 31.12.2023 |
AAA |
AA |
A |
BBB |
Lower rating |
Total |
|---|---|---|---|---|---|---|
|
Government bonds |
612 472 |
1 456 325 |
406 747 |
80 433 |
36 233 |
2 592 210 |
|
Government-related bonds |
198 601 |
149 019 |
34 615 |
22 373 |
2 369 |
406 977 |
|
Inflation-linked bonds |
48 794 |
193 647 |
24 943 |
15 752 |
- |
283 137 |
|
Corporate bonds |
8 977 |
66 905 |
460 349 |
455 568 |
10 487 |
1 002 288 |
|
Securitised bonds |
239 362 |
41 931 |
1 812 |
- |
- |
283 106 |
|
Total bonds1 |
1 108 207 |
1 907 827 |
928 467 |
574 127 |
49 090 |
4 567 718 |
1 At the end of the first half of 2024, bonds received as collateral amounting to NOK 3.4 billon were sold. At year-end 2023, NOK 2.6 billion were sold. These bonds are presented in the balance sheet as a liability under Secured borrowing.
The bond portfolio increased by NOK 346 billion compared to year-end 2023, to NOK 4 914 billion at the end of the first half. The share of bond holdings with credit rating AA increased to 43.6 percent at the end of the first half, from 41.8 percent at the end of 2023. The increase in the AA category was mainly due to an increased allocation to American, French and UK government bonds. Bonds in the credit rating categories AAA and A decreased slightly in the period, while category BBB increased to 13.2 percent, from 12.6 percent at year-end. The share of bond holdings in the Lower rating category increased to 1.3 percent at the end of the first half, from 1.1 percent at year-end. This is mainly due to an increase in holdings of Brazilian and South African government bonds. Overall, the credit quality in the bond portfolio is somewhat weaker than at year-end.
Counterparty risk
Counterparty risk is the risk of loss due to counterparty bankruptcy or other events leading to counterparties defaulting.
Table 9.5 Counterparty risk by type of position
|
Risk exposure |
||
|---|---|---|
|
Amounts in NOK million |
30.06.2024 |
31.12.2023 |
|
Derivatives including foreign exchange contracts |
112 726 |
102 476 |
|
Securities lending |
73 080 |
66 750 |
|
Unsecured bank deposits1 |
26 444 |
20 188 |
|
Repurchase and reverse repurchase agreements |
5 942 |
19 798 |
|
Settlement risk towards brokers and long-settlement transactions |
4 436 |
2 798 |
|
Total |
222 629 |
212 011 |
1 Includes bank deposits in non-consolidated subsidiaries.
Total counterparty risk exposure increased to NOK 222.6 billion at the end of the first half, from NOK 212.0 billion at year-end 2023. The increase is mainly due to increased risk exposure from derivatives and foreign exchange contracts, securities lending and unsecured bank deposits. The risk exposure from repurchase and reverse repurchase agreements was reduced as a result of lower activity in these instruments. The risk exposure from securities lending increased by 9.5 percent compared to year-end, while counterparty risk exposure from repurchase and reverse repurchase agreements was reduced by 70 percent in the same period. The risk exposure from derivatives including foreign exchange contracts increased by 10 percent compared to year-end, to NOK 112.7 billion. Derivatives and foreign exchange contracts accounted for 51 percent of the total risk exposure at the end of the first half. One third of this exposure was to a clearing house.
Note 10 Foreign exchange gains and losses
Gains and losses on financial instruments are due to changes in the price of the instrument (security element) and changes in foreign exchange rates (foreign exchange element). These are presented separately in the income statement. See note 11 Foreign exchange gains and losses in the annual report for 2023 for further information.
The fund’s market value in Norwegian kroner is impacted by changes in foreign exchange rates. See table 9.1 in note 9 Investment riskfor an overview of the allocation of the GPFG’s investments by asset class, country and currency. The change in the fund’s market value due to changes in foreign exchange rates is presented in table 10.1.
Table 10.1 Specification foreign exchange gain/loss
|
Amounts in NOK million |
1H 2024 |
1H 2023 |
2023 |
|---|---|---|---|
|
Foreign exchange gain/loss - USD/NOK |
288 729 |
436 598 |
114 262 |
|
Foreign exchange gain/loss - EUR/NOK |
38 770 |
254 775 |
150 575 |
|
Foreign exchange gain/loss - JPY/NOK |
-72 745 |
-10 580 |
-33 765 |
|
Foreign exchange gain/loss - GBP/NOK |
33 569 |
105 872 |
64 611 |
|
Foreign exchange gain/loss - CHF/NOK |
-6 496 |
40 695 |
43 197 |
|
Foreign exchange gain/loss - other |
32 565 |
153 072 |
70 561 |
|
Foreign exchange gain/loss |
314 393 |
980 432 |
409 441 |
Note 11 Management costs
Management costs comprise all costs relating to the management of the fund. These are mainly incurred in Norges Bank, but management costs are also incurred in subsidiaries of Norges Bank that are exclusively established as part of the management of the GPFG’s investments in unlisted real estate and unlisted renewable energy infrastructure.
Management costs in Norges Bank
The Ministry of Finance reimburses Norges Bank for costs incurred in connection with the management of the GPFG, in the form of a management fee. The management fee is equivalent to the actual costs incurred by Norges Bank, including performance-based fees to external managers, and is expensed in the income statement line Management fee. Costs included in the management fee are specified in table 11.1.
Table 11.1 Management fee
|
1H 2024 |
1H 2023 |
2023 |
||||
|---|---|---|---|---|---|---|
|
Amounts in NOK million |
Basis points |
Basis points |
Basis points |
|||
|
Salary, social security and other personnel-related costs |
1 050 |
972 |
2 045 |
|||
|
Custody costs |
243 |
226 |
464 |
|||
|
IT services, systems, data and information |
410 |
383 |
773 |
|||
|
Research, consulting and legal fees |
113 |
128 |
269 |
|||
|
Other costs |
137 |
141 |
276 |
|||
|
Allocated costs Norges Bank |
115 |
138 |
256 |
|||
|
Base fees to external managers |
909 |
719 |
1 205 |
|||
|
Management fee excluding performance-based fees |
2 977 |
3.3 |
2 707 |
3.7 |
5 289 |
3.6 |
|
Performance-based fees to external managers |
1 289 |
796 |
1 343 |
|||
|
Management fee |
4 267 |
4.4 |
3 502 |
4.6 |
6 632 |
4.5 |
Management costs in subsidiaries
Management costs incurred in wholly owned subsidiaries consist of costs related to the management of the investments in unlisted real estate and unlisted renewable energy infrastructure. These costs are expensed directly in the portfolio result and are not part of the management fee.
Management costs incurred in non-consolidated subsidiaries are presented in the income statement lines Income/expense from unlisted real estate and Income/expense from unlisted infrastructure. Management costs incurred in consolidated subsidiaries are presented in the income statement line Other income/expense. These costs are specified in table 11.2.
Table 11.2 Management costs subsidiaries
|
1H 2024 |
1H 2023 |
2023 |
||||
|---|---|---|---|---|---|---|
|
Amounts in NOK million |
Basis points |
Basis points |
Basis points |
|||
|
Salary, social security and other personnel-related costs |
15 |
17 |
34 |
|||
|
IT services, systems, data and information |
3 |
3 |
5 |
|||
|
Research, consulting and legal fees |
26 |
26 |
52 |
|||
|
Other costs |
20 |
27 |
58 |
|||
|
Total management costs subsidiaries1 |
64 |
0.1 |
72 |
0.1 |
148 |
0.1 |
|
Of which management costs non-consolidated subsidiaries |
38 |
45 |
89 |
|||
|
Of which management costs consolidated subsidiaries |
27 |
27 |
59 |
|||
1 Costs in the first half of 2024 comprised NOK 60 million related to investments in unlisted real estate and NOK 4 million related to investments in unlisted renewable energy infrastructure. For the first half of 2023, NOK 69 million was related to investments in unlisted real estate and NOK 3 million was related to investments in unlisted infrastructure.
Upper limit for reimbursement of management costs
Every year the Ministry of Finance establishes an upper limit for the reimbursement of management costs. Norges Bank is only reimbursed for costs incurred within this limit. Norges Bank is also reimbursed for performance-based fees to external managers. These fees are not measured against the upper limit.
For 2024, total management costs incurred in Norges Bank and its subsidiaries, excluding performance-based fees to external managers, are limited to NOK 7 100 million. In 2023, the limit was NOK 6 200 million.
At the end of the first half, management costs measured against the upper limit amounted to NOK 3 042 million. This consisted of management costs in Norges Bank, excluding performance-based fees to external managers, of NOK 2 977 million and management costs in subsidiaries of NOK 64 million. Total management costs including performance-based fees to external managers amounted to NOK 4 331 million.
Costs measured as a share of assets under management
Annualised costs are also measured in basis points, as a share of average assets under management. Average assets under management are calculated based on the market value of the portfolio in Norwegian kroner at the start of each month in the calendar year.
At the end of the first half, management costs incurred in Norges Bank and its subsidiaries, excluding performance-based fees to external managers, corresponded to 3.4 basis points of assets under management. Management costs including performance-based fees to external managers corresponded to 4.5 basis points of assets under management.
Other operating costs in subsidiaries
In addition to the management costs presented in table 11.2, other operating costs are also incurred in subsidiaries related to the ongoing maintenance, operation and development of the investments. These are not costs related to investing in real estate or renewable energy infrastructure but are costs of operating the underlying investments once they are acquired. Therefore, they are not defined as management costs. Other operating costs are expensed directly in the portfolio result and are not part of the management fee. They are also not included in the costs measured against the upper limit.
Other operating costs incurred in non-consolidated subsidiaries are presented in the income statement lines Income/expense from unlisted real estate and Income/expense from unlisted infrastructure. For further information, see table 6.4 in note 6 Unlisted real estate and table 7.4 in note 7 Unlisted renewable energy infrastructure. Other operating costs incurred in consolidated subsidiaries are presented in the income statement line Other income/expense.
Auditor
Auditor's report
To the Supervisory Council of Norges Bank
Report on review of interim financial information
Introduction
We have reviewed the accompanying condensed balance sheet of the Government Pension Fund Global as of 30 June 2024 and the related condensed income statement, statement of changes in owner’s capital and statement of cash flows for the period 1 January 2024 to 30 June 2024. The Executive Board and management are responsible for the preparation and presentation of this interim financial information in accordance with IAS 34 Interim Financial Reporting. Our responsibility is to express a conclusion on this interim financial information based on our review.
Scope of review
We conducted our review in accordance with the international standard on review engagements 2410, ”Review of Interim Financial Information Performed by the Independent Auditor of the Entity”. A review of interim financial information consists of making inquiries, primarily of persons responsible for financial and accounting matters, and applying analytical and other review procedures. A review is substantially less in scope than an audit conducted in accordance with International Standards on Auditing and consequently does not enable us to obtain assurance that we would become aware of all significant matters that might be identified in an audit. Accordingly, we do not express an audit opinion.
Conclusion
Based on our review, nothing has come to our attention that causes us to believe that the accompanying interim financial information is not prepared, in all material respects, in accordance with IAS 34 Interim Financial Reporting.
Oslo, 9 August 2024
Ernst & Young AS
Kjetil Rimstad
State Authorized Public Accountant (Norway)
This translation from Norwegian has been prepared for information purposes only.